.svg)





 Canada (EN)
 Global (EN)


Canadian employees' well-being declined across nearly every dimension in 2026, with sleep, financial health, and mental health showing the sharpest drops compared to 2025. Nearly 8 in 10 employees say these challenges have affected their ability to do their job. Among employees with workplace health benefits, 67% used them in the past year, but only 20% were very satisfied with the experience — and only 31% of HR leaders receive regular, clear data from their benefits provider to prove those programs are working.
This report, based on independent research conducted by Leger for Dialogue, examines what is driving the gap between benefits offered and outcomes delivered, and what HR leaders can do to close it.
Research methodology
The findings presented in this report are based on independent research conducted by Leger, on behalf of Dialogue. The strategic interpretations and recommendations throughout the report reflect Dialogue's own analysis, informed by its experience in the employee health and benefits landscape, and should be read as informed professional opinion rather than direct empirical conclusions of the study itself.
The research drew on two parallel surveys:
-
Employed Canadians: a 12-minute online quantitative survey of 1,002 employed Canadians aged 18+, conducted in French and English via Leger's panel between April 29 and May 13, 2026.
-
HR professionals: a 7-minute online quantitative survey of 200 HR decision-makers aged 18+, conducted in French and English via Leger's panel between April 29 and May 19, 2026.
The research set out to understand the evolving health and well-being pressures facing employed Canadians, assess how those pressures connect to business priorities, identify gaps in access and utilization, and explore what employers need from a benefits provider.
Executive summary
Workplace well-being in 2026 is no longer just about offering benefits — it's about ensuring employees can access meaningful support when and where they need it.
-
Sleep, finances, mental health, physical health, and social connection all declined significantly compared to 2025, and for 8 in 10 Canadian employees, these challenges have affected their ability to work in the past year. The pressures employees navigate now also extend beyond traditional benefit categories, including cost of living, burnout, caregiving, hormonal health, and financial stress.
-
Employees need support that reflects the realities they're navigating, and benefits alone aren't closing that gap. Among employees with workplace health benefits, 67% used them in the past year, only 20% were very satisfied with the experience.
-
For the employees who didn't use their benefits, barriers like convenience, trust, navigation, and relevance stand between wanting support and receiving it — and when needs go unmet, they show up at work: 3 in 4 say they worked while health or stress significantly reduced their productivity at least occasionally in the past year.
-
HR leaders, meanwhile, need benefits that are easier to activate and measure. Employers recognize that well-being is directly tied to engagement, retention, productivity, absenteeism, and mental health-related strain — but even where support exists, it's often hard to communicate, navigate, and measure. Only about 3 in 10 HR leaders say they receive regular, clear insights from their benefits provider, leaving a gap between what's invested and what can be proven to work. That gap is becoming harder to ignore: while 45% of HR leaders expect well-being investment to increase through 2027, budget constraints, change fatigue, and the ongoing challenge of demonstrating impact continue to slow progress.
The opportunity for employers is to move from benefit provision to benefit activation: creating health experiences that are easy to find, access, and trust — backed by data that links usage to outcomes so that well-being investment translates into measurable results.

The key insights, ready to act on
Download our Key Takeaways report — the core findings from the 2026 State of Workplace Well-being, distilled for HR leaders shaping their benefits strategy.
Why is employee well-being declining in 2026?
Several dimensions of well-being worsened compared to 2025, and the effects are already showing up as lost productivity and missed work.
1. Workforce under broader pressure from work and life stressors
Well-being declined across every dimension measured. 38% of employees say their sleep quality has worsened in the past year, 35% say their financial situation has worsened, 35% say their mental health has worsened, 30% say their physical health has worsened, and 20% say their relationships and social connections have worsened.
The consequences are already visible at work: when asked how much personal health or well-being challenges affected their ability to do their job in the past 12 months, 10% of employees said "a great deal," 11% said "a lot," 26% said "somewhat," and 31% said "a little" — meaning roughly 8 in 10 employees report at least some impact, versus 21% who report none at all.
What this means for HR leaders: these aren't isolated wellness concerns. Sleep disruption, financial stress, and mental health strain are associated with absenteeism, presenteeism, and higher turnover risk.
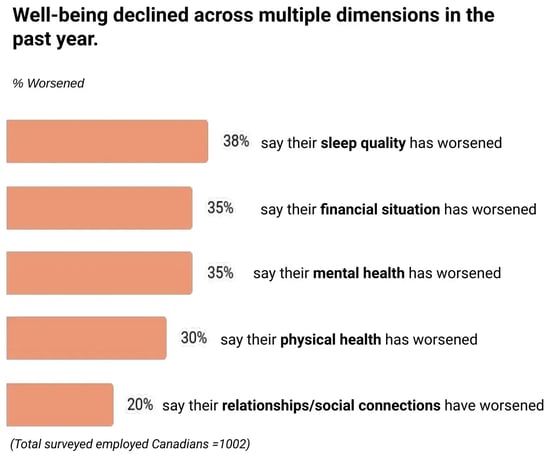
Well-being declined across multiple dimensions in the past year.
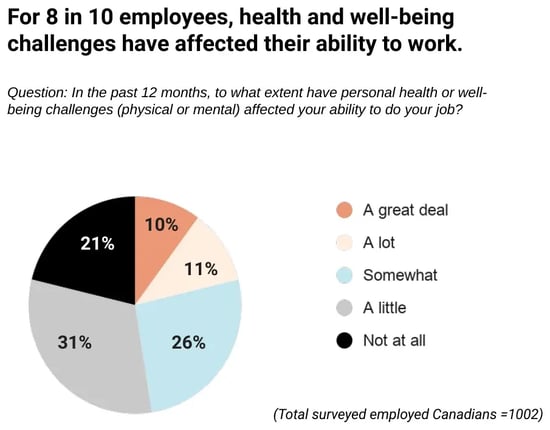
For 8 in 10 employees, health and well-being challenges have affected their ability to work.
2. How employee burnout is affecting productivity
Employees are bringing overlapping pressures into the workplace. While the rising cost of living (48%) remains the leading well-being stressor, micro-burnout (30%), doom-scrolling (29%), increasing work demands (27%), and global instability (27%) are compounding the strain.
Connection is part of the pressure story too: while 52% of employees feel socially connected, 57% feel exhausted by constant communication, and 58% wish they had more meaningful human connection.
As a result, only 21% of employees report feeling energized and motivated most days, 29% feel tired but usually recover quickly, 31% cycle through periods of burnout and recovery, and 19% feel persistently burnt out — meaning roughly 1 in 2 employees are experiencing burnout or cycling through it.
Why this matters for HR leaders: this isn't just a well-being concern, it's a business risk. When energy is low and burnout is high, productivity drops, absenteeism rises, and retention becomes harder to sustain.
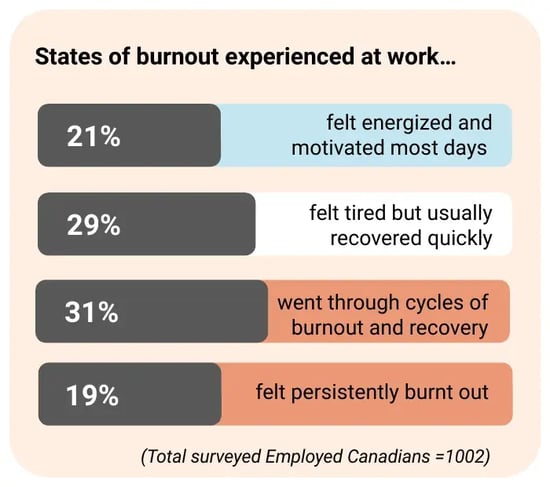 States of burnout experienced at work.
3. Why employees struggle to access the well-being support they need
Employees' top well-being priorities for the year are their financial situation (49%), physical health (43%), mental health (34%), physical exercise (29%), work-life balance (28%), diet and nutrition (26%), work and career (25%), relationships and social connections (25%), sleep-related issues (14%), child or elder care (11%), legal challenges (5%), and substance use or addiction (3%).
Some of these same priorities are the hardest to get support for. While 60% of employees say it's easy to get support for physical health, 52% say it's difficult to get support for their financial situation, 48% say the same for sleep quality, and 46% say the same for mental health.
The key barriers to seeking care are lack of time and a busy schedule (37%), cost of services or treatments (36%), long wait times to access care (34%), lack of motivation (27%), and difficulty finding an appropriate provider (20%).
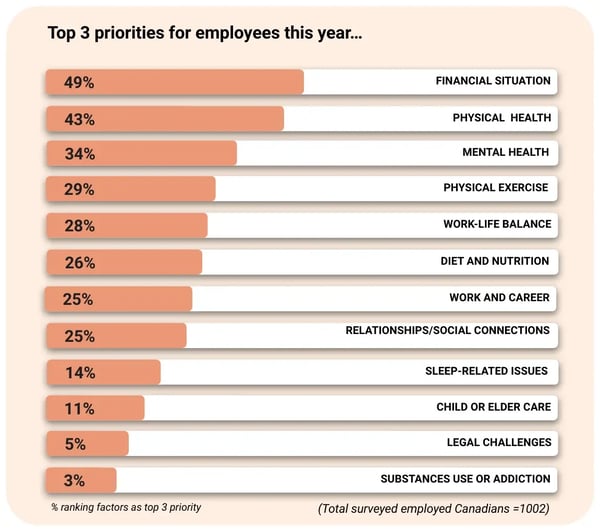 Top 3 priorities for employees this year.
4. Lost time and reduced productivity are already on the books
Personal health and well-being challenges aren't staying outside the workplace. On average, employees missed 5 working days in the past year due to health and well-being challenges: 31% missed 0 days, 20% missed 1–2 days, 19% missed 3–5 days, 14% missed 6–10 days, 6% missed 11–20 days, and 7% missed more than 20 days.
Presenteeism is even more widespread: 74% of employees say their productivity has been reduced at least occasionally for physical or mental health reasons — 15% "very frequently," 26% "frequently," 33% "occasionally," 15% "rarely," 9% "never," and 2% "don't know."
For a 1,000-person workforce, an average of 5 missed workdays per employee translates to up to 5,000 lost workdays each year — before accounting for the added impact of reduced productivity while employees are working but not at their best.
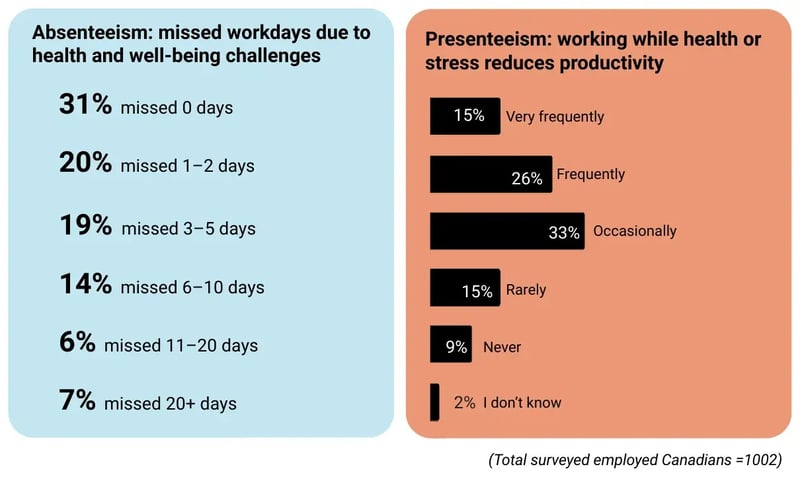
Absenteeism and presenteeism linked to health and well-being challenges.
5. What gets in the way of employee well-being at work?
Supporting employee well-being is a workforce performance strategy. HR leaders say the priorities they care about most can be directly addressed through better well-being support: talent retention and attraction (71%), employee engagement and job satisfaction (69%), productivity loss (61%), mental health and workplace stress (60%), absenteeism and presenteeism (56%), financial well-being (56%), physical health (55%), workplace innovation (50%), diversity, equity, and inclusion (46%), and short and long-term disability management (45%).
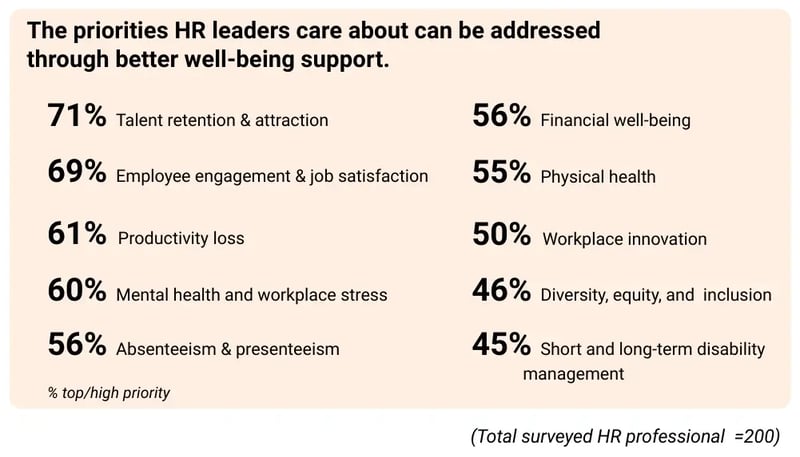 The priorities HR leaders care about can be addressed through better well-being support.
Are employees satisfied with their workplace benefits?
Having benefits and maximizing their impact are two different things — and right now, most Canadian employers are only solving for the first one.
1. Usage is high. Satisfaction is not.
Among employees with workplace health benefits, 67% used them in the past year., but only 20% were very satisfied with the experience. Among those who actually used their benefits, satisfaction breaks down as 20% very satisfied, 48% somewhat satisfied, 17% neither satisfied nor dissatisfied, 12% somewhat dissatisfied, and 3% very dissatisfied.
What makes benefits feel effective, among employees who used at least one workplace health benefit: affordability and good coverage (45%), ease of access (39%), clarity about what's available (32%), and timely support with short wait times (22%).
The takeaway: the problem isn't whether employees use benefits — it's whether the experience is clear, trusted, and easy enough to convert need into action.
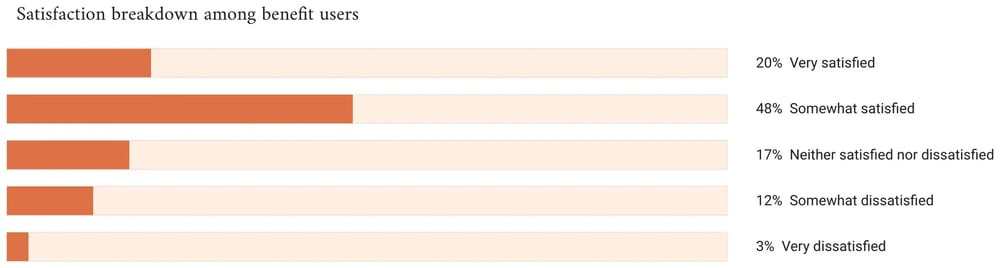
Usage is high; satisfaction is not. Satisfaction breakdown among benefit users.
2. What stops some employees from using group benefits?
Only 36% of employees who didn't use their benefits say they simply didn't need to. The other 2 in 3 point to barriers employers can influence: 18% prefer to handle their own needs, 15% say they didn't have time or it wasn't convenient, 13% use other resources instead, 12% say the benefits didn't meet their needs, 11% weren't sure what was available or covered, 11% weren't sure how to access their benefits, 10% were concerned about a perceived negative effect at work, 7% were concerned about confidentiality or privacy, and 6% found benefits difficult to access (base: employees who haven't used benefits, n=227).
The opportunity: for employers, the risk is under-activated investment — benefits may be available, but employees may not know when to use them, trust them enough to engage, or find them easy to navigate. Removing these barriers through clearer communication, simpler access points, and more personalized pathways to care can convert existing investment into actual usage.
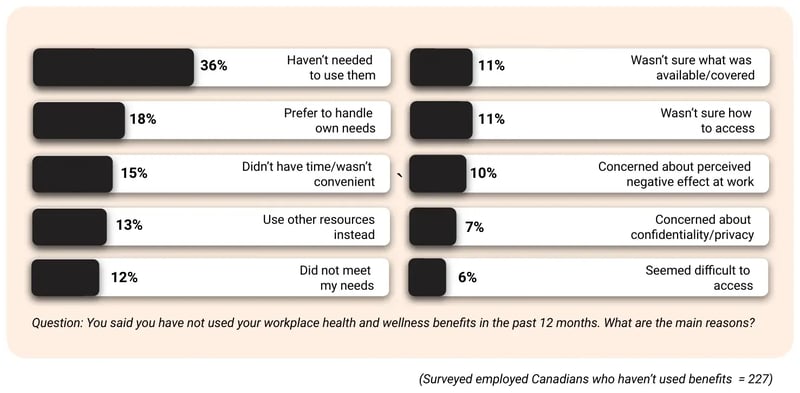 Why are non-users not engaging?
Why workforce well-being is a strategic priority for HR leaders in Canada
Employee well-being is firmly on the radar, but there's a gap between recognizing its importance and treating it as core strategy.
77% of HR leaders say well-being is a priority within their people strategy, and 45% expect investment to increase through 2026 and 2027. Within that group, 49% describe it as an important but secondary priority, 28% as a central strategic priority, 13% as a tactical or reactive focus, and 10% say it's not a formal focus at all.
Organizations' top well-being focus areas for 2026–2027 are employee engagement and morale (49%), talent retention and turnover reduction (49%), mental health (35%), financial well-being (32%), absenteeism and productivity management (28%), and physical health and preventative care (26%).
Why this matters: the question is no longer whether well-being matters to HR leaders, but where to invest. The focus is shifting toward programs that improve the workforce performance outcomes HR is accountable for — engagement, retention, productivity, absenteeism, and mental health-related strain.
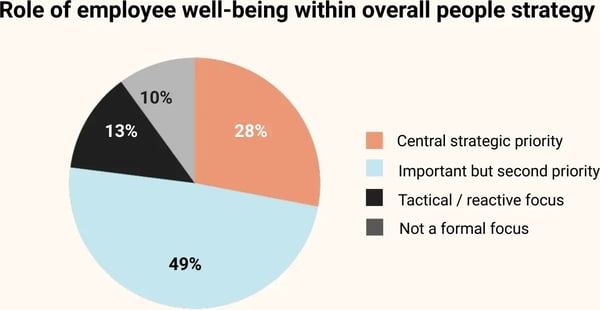 Role of employee well-being within overall people strategy.
Execution is where well-being strategies stall
Organizations face two distinct challenges: internal readiness barriers, and implementation challenges once programs are already launched.
On the readiness side, HR leaders cite budget constraints across HR initiatives (40%), insufficient internal resources or expertise (33%), challenges coordinating across departments (26%), competing business priorities (24%), misalignment between employee needs and organizational direction (21%), lack of leadership alignment or strategic prioritization (21%), organizational resistance to change (19%), and limited access to reliable data or insights (11%) — 17% say none of the above apply.
Once a program is implemented, HR leaders still struggle with securing sufficient budget (37%), driving employee awareness and engagement (23%), addressing change fatigue or competing employee demands (23%), tailoring programs to diverse employee needs (22%), and measuring impact, outcomes, or ROI (21%).
The takeaway: budget is only one part of the problem. To close the gap, employers need well-being partners that make programs easier to implement, easier for employees to engage with, and easier for HR teams to measure.
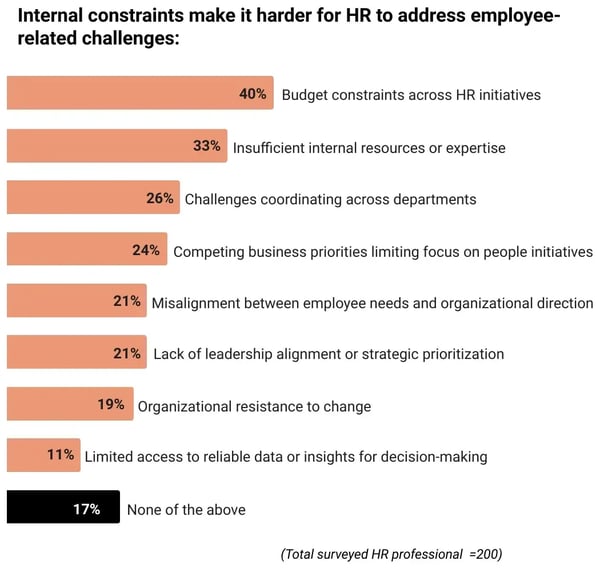
Internal constraints make it harder for HR to address employee-related challenges.
Do benefit portfolios match today's employee needs and behaviours?
HR priorities are outcome-focused — engagement, retention, mental health. Yet many of the benefits that address the daily pressures behind those outcomes remain the least commonly offered.
1. Evolving employee needs are testing traditional benefit design
Employees report a wide range of health and well-being challenges in the past 12 months: ongoing sleep problems (44%), challenges managing weight (39%), chronic pain (30%), ongoing mental or emotional concerns (30%), ongoing physical health concerns (29%), difficulty with focus or attention (29%), perimenopause or menopause-related symptoms (16%), sexual health concerns (14%), respiratory symptoms (8%), and other hormonal or physical symptoms (8%).
Weight management is a clear example of how employee needs are outgrowing single-category benefit design: 4 in 10 employees report challenges managing their weight, and 20% have used, considered, or been prescribed medication for it — yet weight management spans prescription drugs, primary care, nutrition, mental health, and prevention, rarely fitting into one care category.
For HR leaders: this is an opportunity to modernize benefits — reassessing drug coverage, strengthening care navigation, and introducing integrated wraparound support so offerings keep pace with the realities of employees' health needs.
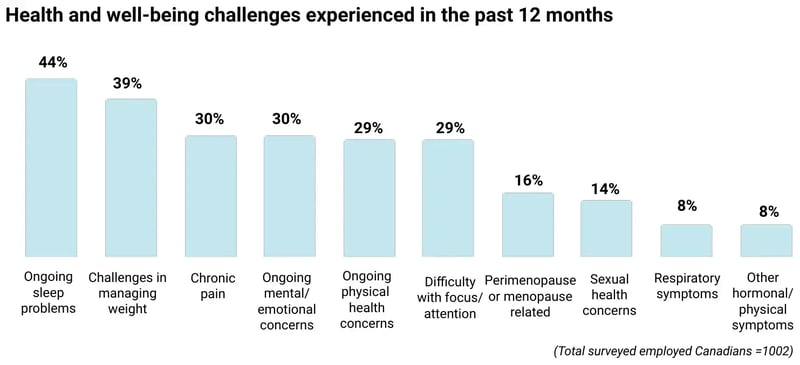
Health and well-being challenges experienced in the past 12 months.
2. Benefit portfolios have not caught up to the pressures affecting workforce performance
Looking at coverage offered by employers in 2026, core coverage and workplace supports remain the most common: physical health coverage (50%), disability benefits (38%), mental health counselling or EAP (36%), additional paid time off (26%), and flexible work arrangements (24%). Supports for everyday lifestyle pressures are far less common: preventative care and wellness support (14%), legal support services (11%), relationship support (10%), financial support (10%), nutrition and weight management support (8%), and child or eldercare support (4%).
The takeaway: the challenge is no longer whether benefits exist, but whether the mix of benefits reflects the realities employees are navigating today. The right combination can help employees stay healthy, engaged, and productive for longer.
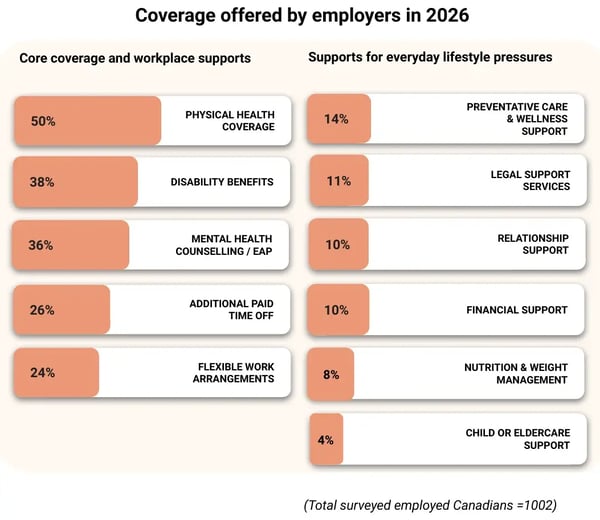
Coverage offered by employers in 2026.
3. The prevention gap is an access gap and an employer opportunity
85% of employees value preventive care, but 60% are delaying everyday health maintenance because of cost, wait times, or uncertainty about where to go. In the past year, employees delayed or avoided due to cost: healthy food choices (39%), dental or vision care (33%), fitness or physical activity (33%), mental health care (27%), prescription medication (16%), and preventative screening (16%).
The reasons employees delay care before needs escalate: wait times (27%), cost (23%), uncertainty about where to go (19%), stigma or discomfort (10%), and lack of a primary care practitioner (10%).
Only about 1 in 4 organizations say they're already using a prevention-first benefit model. Most (55%) are still piloting and exploring, and 20% haven't made it a priority — even as employees are already delaying care due to cost, wait times, and uncertainty.
Why this matters: delayed care can allow manageable conditions to become more disruptive, affecting productivity, absenteeism, engagement, and long-term claims. A prevention-first benefits strategy helps employees act earlier by making care easier to afford, navigate, and access before needs escalate.
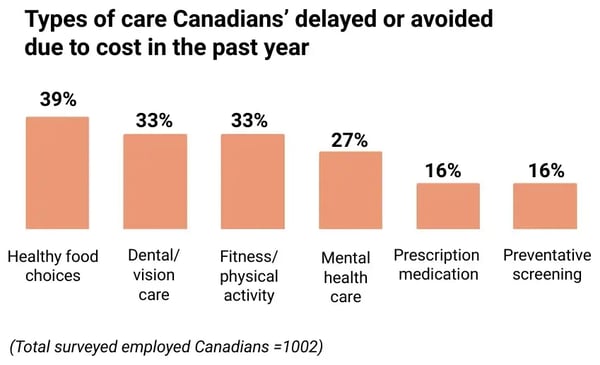
Types of care Canadians delayed or avoided due to cost in the past year.
4. Trust is part of the health equation, but misinformation is a growing challenge
74% of employees agree that misinformation has made it harder to know what health advice to trust. Licensed healthcare professionals remain the most trusted source of health information (90%). At the same time, roughly half of employees (47%) turn to AI for health research and navigation: 13% frequently, 34% occasionally, 21% don't but would like to, and 32% don't and wouldn't like to.
Among employees who have used AI for health purposes, the top uses are understanding symptoms (53%), researching health conditions (52%), lifestyle or wellness advice (38%), getting an initial opinion (35%), and getting a second opinion (28%). Employees are turning to AI because it is easy and immediate. While 42% trust AI as a health information source, nearly 5 in 10 have encountered health information online that later turned out to be misleading or false.
How employers can limit misinformation in healthcare: provide one easy-to-find entry point for health and well-being support, make benefit coverage and care options simple to understand, offer fast navigation to the right service or professional, share trusted health resources in plain language, and reinforce confidentiality so employees feel safe seeking help.
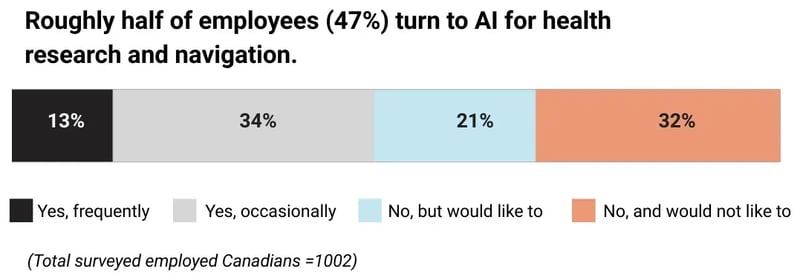
Roughly half of employees turn to AI for health research and navigation.
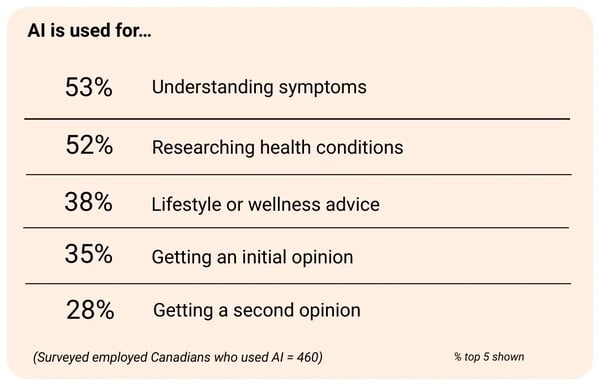
AI is used for...
How do you measure the ROI of employee well-being programs?
Most HR leaders don't receive regular, clear, and actionable insights from their well-being providers — making it harder to understand utilization, demonstrate ROI, and make the case to leadership.
1. Employers need better data to prove well-being impact
Only 31% of HR leaders say they receive data regularly, with clear and actionable insights. 39% receive data only occasionally, and mostly raw or difficult to interpret; 27% rarely or never receive meaningful data; and 4% are unsure.
HR leaders need evidence that programs are improving productivity (91% say this metric is important), retention (88%), employee satisfaction and feedback (86%), cost savings or claims reduction (85%), financial/ROI data (81%), impact on disability or leave of absence (79%), benefits utilization and engagement (77%), and external benchmarks or best practices (74%).
The takeaway: the need is shifting from reporting activity to proving impact. Well-being reporting has to move past basic utilization data and demonstrate real impact on employee experience, access, and workforce outcomes — this is a critical measurement gap, since employers can see the importance of well-being but often lack the insight to know what's working, where the gaps are, and how to build a business case for leadership.
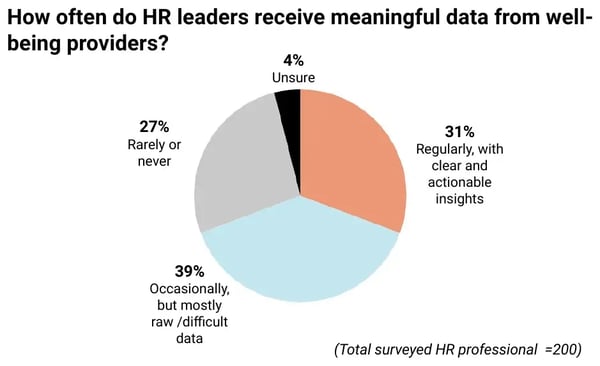
How often do HR leaders receive meaningful data from well-being providers?
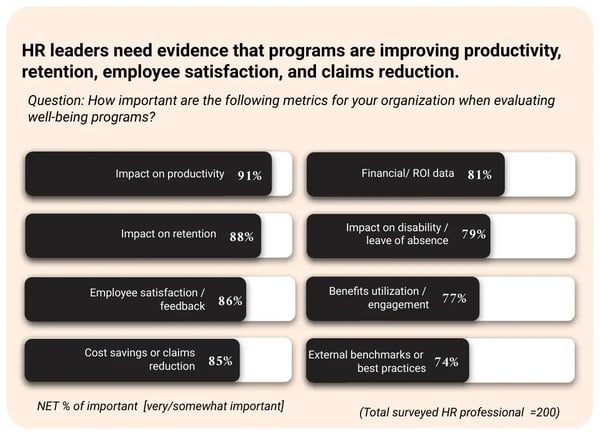 HR leaders need evidence that programs are improving productivity, retention, employee satisfaction, and claims reduction.
2. Choosing the right benefits provider means setting a higher bar
While 94% of HR professionals say care quality is a key factor when selecting a provider, 1 in 4 don't believe employees are actually receiving safe, high-quality care today from their current provider. That gap is a risk to health outcomes, trust in benefits, and ROI.
On their current provider, HR leaders are generally positive about access and navigation but less confident about quality: 83% agree employees can access care quickly when they need it, 82% agree it's easy for employees to find and navigate available services, but only 75% agree employees receive care that is safe and high-quality.
The features HR professionals rate as important when selecting or evaluating a provider: cost competitiveness (96%), breadth of coverage and services (94%), quality of coverage and services (94%), ease of administration (92%), member experience (92%), account management (89%), data and reporting capabilities (86%), Canadian market presence and leadership (85%), and innovation and future roadmap (84%).
Employees, meanwhile, say what makes benefits feel effective is affordability (45%), ease of access (39%), and clarity about what's covered (32%) — the right provider has to serve both sides of that equation.
What should HR leaders look for in a benefits partner in 2026?
To measurably support team well-being, HR leaders should prioritize providers that guarantee high clinical quality, deliver an exceptional member experience, and keep administration simple and supportive.
1. What the data says about choosing benefits providers in Canada
Simply offering coverage is no longer a measure of success — the real test is performance, across four dimensions:
- Full-spectrum support: does your provider address the full range of employee pressures beyond traditional conditions, or just a single program or point solution? Good looks like integrated support across physical health, mental health, wellness, prevention, EAP, and emerging health needs, with clear pathways to the right care.
- Access that drives utilization: is support easy to access and use, and does your benefits partner actively help drive that engagement? Good looks like one clear entry point, fast triage, guided navigation, and simple next steps.
- Prevention, not just crisis response: does your provider help employees act earlier, before needs become urgent or disruptive? Good looks like screenings, coaching, preventive care, mental health support beyond counselling, and proactive pathways.
- Reporting tied to business outcomes: can your provider connect utilization and experience data to the outcomes HR leaders are measured on? Good looks like reporting that links engagement, access, satisfaction, absenteeism, retention, leave of absence, productivity, and ROI.
For HR leaders, this means shifting from vague expectations to defined commitments: response-time guarantees, utilization benchmarks, and outcome reporting tied directly to retention, absenteeism, and cost.
2. The opportunity ahead for HR leaders
Employees' well-being is declining. Benefits are being used, but not to their full potential. And while HR leaders are clear on the outcomes they need, many still lack the data to prove their programs are delivering. This is where the opportunity lies: Dialogue's Integrated Health Platform is built to close these gaps by expanding access, broadening coverage, strengthening prevention, and delivering the support and insights HR leaders need to measure results and drive better workforce outcomes.
Discover how Dialogue's Integrated Health Platform closes workforce health gaps
About Leger
Leger is Canada's largest Canadian-owned polling, market research, and analytics firm, with more than 300 employees across Canada and the United States. Founded in 1986, Leger also owns LEO, its online research panel, and LEA, its analytics division. For more information, visit leger360.com.